More on Two Variable Relationships
|
More on Two Variable Relationships |
||
| Main Concepts | Demonstration | Activity | Teaching Tips | Data Collection & Analysis | Practice Questions | Milestone | Fathom Tutorial | ||
|
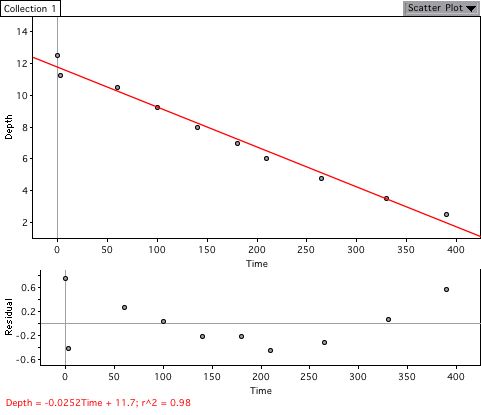
Dan Teague, from the North Carolina School of Science and Mathematics, collected these data on a sultry summer afternoon. The first data set is the depth of lemonade (inches) in an urn and time (seconds), as the urn is being emptied. The urn is one of those with the spigot at the bottom of the urn. A plot of the data is shown, along with the regression line and the residual plot.
|
||
|
The equation of the line is Depth = -0.0252Time + 11.7; r^2 = 0.98. 1. Is the regression line a good fit? If 'yes', explain why. If 'no', suggest how the fit might be improved. 2. A student says that the high r-squared value means this is a good fit. What would you say to this student?
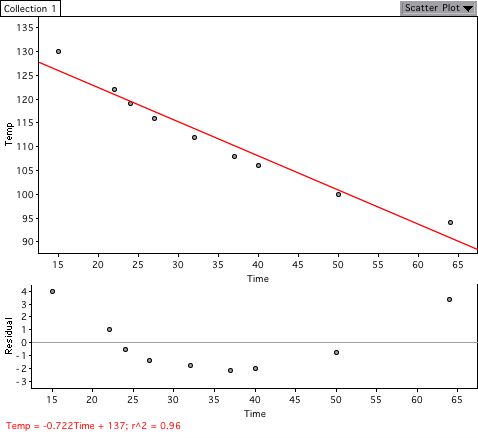
The second data set consists of the temperature of a cup of coffee measured over time (minutes), as the cup is allowed to cool in the kitchen where the room temperature is 81 degrees F.
3. What temperature does the linear model predict we will see after 3 hours (180 minutes). Assuming the temperature in the room stays at 81 degrees, what temperature should the model predict we will see?
4. Comment on the fit of the model. How would you improve the
fit? If you'd like to read the solutions, go ahead, but please try your best to answer the questions, first. You can also read Dan Teague's discussion, "Advanced applications of re-expression." |