|
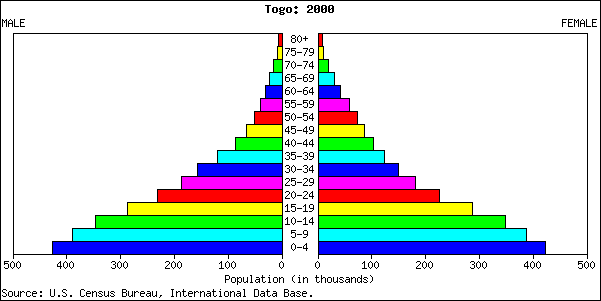
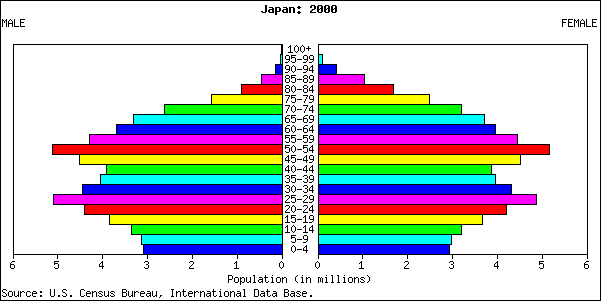
Below are two graphs called
“population pyramids”. They are histograms showing the population of a
country broken down by age (vertically) and sex (left and right
halves). The vertical axis is age of the nation’s citizens and the
horizontal axis number of people in each age range.
The two countries
shown here are Japan and Togo (one of the world’s developing nations).
Answer the questions below on a separate sheet of paper. You will be
able to check your answers by clicking on the link at the bottom of the
page. If you wish to discuss your answers and the solutions, email your
instructor.
1. What are the approximate median ages for these two populations?
A Japan, 40-44; Togo, 20-24.
B Japan, 40-44; Togo, 35-39.
C Japan, 50-54; Togo, 0-4.
Explain:
2. In which of the countries is the number of children under age 10
greater?
A Japan
B Togo
C You can’t tell from the graphs.
Explain:
3. Which of the following statements are plausible, given the graphs?
I Togo has a high mortality rate.
II Japanese women tend to live longer than men.
III Japan experienced a post-WWII baby boom similar to that in the
United States.
A I and II only
B II and III only
C I and III only.
D all three are plausible.
Explain:
4. What would you expect to be true of the distribution of the ages at
which college graduates earned their college degree?
A It would be approximately symmetric.
B It would be left-skewed.
C It would be right-skewed.
Explain:
Check
your answers.
|